First Phase Land Use Distribution: What the Numbers Reveal About the Planning Approach
Posted By
Harnandipuram Ghaziabad
Date
September 15, 2026
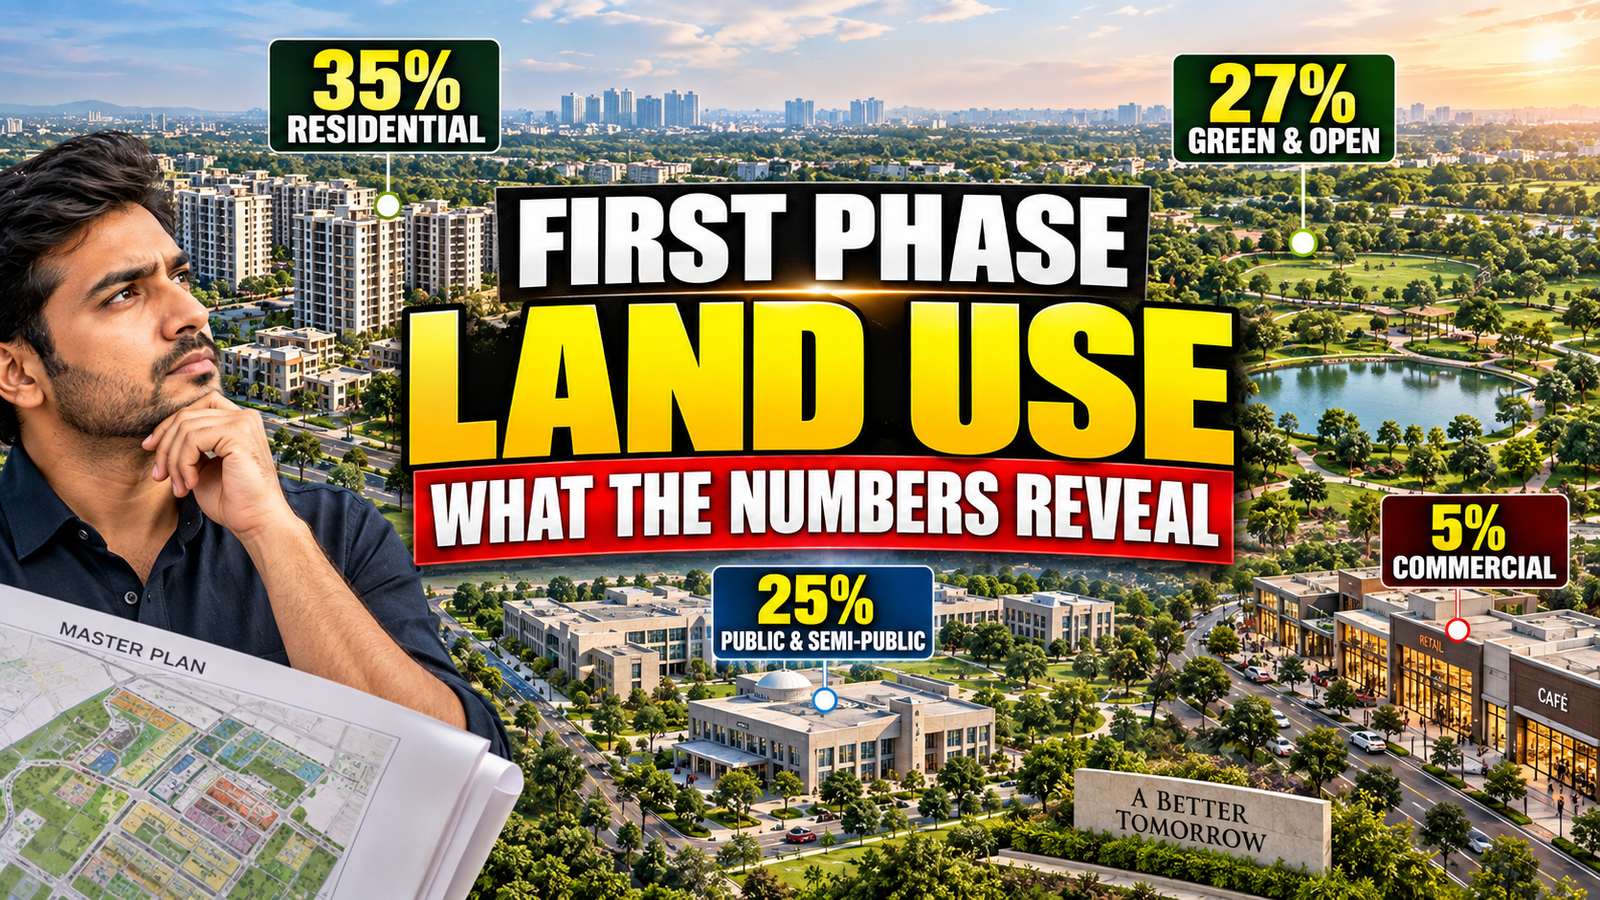
Table of Contents
- What Is the First Phase Land Use Distribution?
- How Is Land Allocated in the First Phase?
- Residential Area — Approximately 35%
- Green and Open Area — Approximately 27%
- Public and Semi-Public Use — Approximately 25%
- Commercial Area — Approximately 5%
- What Does This Land-Use Mix Indicate?
- Integrated Urban Development vs Conventional Plotted Colony
- Why Green and Public Areas Matter
- What Prospective Residents and Buyers Should Understand
- Frequently Asked Questions
The First Phase land use distribution gives an early, useful window into how a development has been planned before a single unit is handed over. When you look at how a project divides its land among homes, open spaces, public facilities and shops, you get a fairly honest picture of its priorities. This article walks through the reported figures for the First Phase, explains what each category typically means, and discusses what this kind of allocation can reasonably suggest — without stretching the numbers into claims they don't support.
What Is the First Phase Land Use Distribution?
Land use distribution simply refers to how the total land within a project or phase has been divided across different purposes. In the case of this First Phase, the reported figures are as follows: approximately 35% for residential use, 27% for green and open area, 25% for public and semi-public use, and 5% for commercial use.
Added together, these four figures come to approximately 92%. That leaves about 8% of the land unaccounted for in the information available. This is worth saying plainly: the remaining 8% is not specified, and there is no reliable basis here to guess what it covers. It could relate to roads, utilities, buffer zones or something else entirely, but without an official master plan or planning document confirming this, it would be irresponsible to assign it a category. So this article sticks to what is actually known and avoids filling that gap with assumptions.
It's also worth noting that these percentages should be treated as reported figures rather than officially verified data, unless a planning authority or the project's own official documentation confirms them independently.
How Is Land Allocated in the First Phase?
Land allocation in any phased development usually follows a broad planning logic, even when the exact rationale isn't publicly detailed. Developers and planners typically work backward from expected population density, local development control regulations, and the intended character of the neighbourhood.
In this case, the First Phase shows land spread across four broad categories: living spaces, open and green spaces, community and institutional facilities, and commercial activity. This kind of four-way split is common in townships and larger residential developments across India, though the exact proportions vary a great deal from one project to another depending on local norms, saleable area targets, and the developer's positioning of the project.
A quick summary of the reported distribution is below for easy reference.
| Land Use | Approximate Share |
|---|---|
| Residential | 35% |
| Green/Open Area | 27% |
| Public/Semi-Public | 25% |
| Commercial | 5% |
| Not specified in the supplied figures | Approximately 8% |
This table reflects only the figures made available. No category has been added or removed beyond what was reported, and the unspecified 8% has been labelled honestly rather than attributed to any assumed use.
Residential Area — Approximately 35%
Residential land, at roughly 35%, forms the largest single share of the First Phase. This is where housing units, whether independent plots, row houses or apartment blocks, would typically be developed. A little over a third of the land going toward homes is a reasonably standard proportion for a mixed-use residential project, and it leaves meaningful room for everything else the development needs to function well.
What this figure does not tell us, on its own, is the density of housing, the mix of unit sizes, or the exact configuration of buildings within that 35%. Those details would come from the layout plan and building sanctions, not from the land-use percentage alone. So while 35% gives a sense of scale, it's the supporting planning documents that would clarify how that land actually translates into homes.
Green and Open Area — Approximately 27%
At close to 27%, green and open space makes up a substantial portion of the First Phase — more than a quarter of the total land. This category generally includes parks, landscaped areas, walking paths, and open recreational spaces that aren't built upon.
A share this size is notably higher than what you'd find in many older, conventional layouts, where green space is often limited to a token park or two. When a development sets aside more than a quarter of its land for open and green use, it usually points to a conscious planning decision rather than a leftover space after buildings were placed. That said, the specific design, quality and usability of this green area would depend on the landscaping plan, which isn't part of the land-use percentage itself.
Public and Semi-Public Use — Approximately 25%
Public and semi-public land use, at roughly 25%, is the third-largest category in this phase. This classification typically covers amenities and facilities meant to serve the community — things like schools, community centres, healthcare facilities, religious or cultural spaces, and other institutional uses, depending on how the specific project defines this category.
A quarter of the total land going toward this kind of use is a meaningful commitment. It suggests that the plan isn't solely focused on maximising saleable residential area, but also allows space for facilities that residents would use in daily life. As with the other categories, the precise list of what falls under "public/semi-public" in this particular project would need to be confirmed through the official planning documents, since this term can be applied somewhat differently across projects and jurisdictions.
Commercial Area — Approximately 5%
Commercial use accounts for the smallest share at around 5%. This would typically cover retail spaces, local shops, or small commercial establishments meant to serve residents within or near the development, rather than large-scale commercial or business districts.
A modest commercial allocation like this is fairly typical for a primarily residential-focused phase. It suggests the intent is to provide convenience-level retail and services close to home, rather than to develop the area as a commercial hub. Larger commercial ambitions, if any, would usually appear in a separate zone or a later phase rather than within a residential-first layout like this one.
What Does This Land-Use Mix Indicate?
Taken together, the reported allocation — roughly 35% residential, 27% green/open, 25% public/semi-public, and 5% commercial — points to a planning approach that balances housing with a fairly generous share of open and community-oriented space. More than half the land, in fact, is dedicated to something other than housing or commerce.
This is worth stating carefully: the figures suggest a planning intent that gives real weight to green space and public facilities alongside residential development. They do not, by themselves, confirm any specific planning classification, regulatory status or master-plan designation. That distinction matters. A percentage breakdown tells you how land has been divided; it doesn't tell you the legal or administrative category under which the project has been approved. That information would only come from the actual master plan, layout approval, or a statement from the relevant planning authority.
So while it's reasonable to say this mix reflects a planning approach that isn't purely density-driven, it would go beyond the available information to assert that the project holds any specific official designation on this basis alone.
Integrated Urban Development vs Conventional Plotted Colony
It helps to understand the conceptual difference between an integrated development and a conventional plotted colony, since the land-use mix here leans toward characteristics often associated with the former.
A conventional plotted colony typically prioritises maximising the number of saleable plots or units, with open space and community facilities often added in smaller, sometimes minimal proportions once regulatory minimums are met. The focus tends to be on efficient land subdivision rather than a broader living environment.
An integrated development, by contrast, is generally planned with housing, open space, community facilities and limited commercial use considered together from the outset, aiming to create a more self-contained living environment. The presence of a large green/open share and a sizeable public/semi-public allocation alongside residential land is the kind of pattern often seen in such developments.
However, it's important to be precise here: having a land-use mix that resembles an integrated development is not the same as being officially classified as one. That classification, where it applies, is typically defined by specific regulatory frameworks or approvals set by state or local planning authorities. Unless such an approval or classification has been explicitly confirmed for this project, the most accurate statement is that the land-use pattern is consistent with an integrated approach, not that the project has been certified as such.
Why Green and Public Areas Matter
Green and public/semi-public land together make up more than half of the reported distribution — around 52% combined. This is a meaningful proportion, and it's worth understanding why such space matters in practical terms, beyond aesthetics.
Open green areas contribute to better air quality, provide space for physical activity, and generally improve the everyday living experience for residents. They also tend to support better stormwater management and reduce the heat build-up that's common in densely built areas, particularly relevant in Indian cities where summer temperatures can be intense.
Public and semi-public facilities, meanwhile, reduce the need for residents to travel far for everyday needs like schooling, healthcare or community gatherings. When such facilities are planned within the development itself, day-to-day convenience improves noticeably, and the neighbourhood tends to function more as a self-sufficient unit rather than depending entirely on surrounding infrastructure.
None of this means the specific facilities in this First Phase are confirmed or finalised — that would depend on subsequent planning and construction. But the land allocation itself suggests that these considerations were factored into the plan from an early stage.
What Prospective Residents and Buyers Should Understand
If you're evaluating a project based on land-use percentages, a few practical points are worth keeping in mind.
First, a land-use percentage is a planning-stage figure. It tells you how land has been designated on paper, not necessarily how it will look once construction is complete. Buyers should always cross-check these figures against the layout plan, building sanctions, and any documentation provided by the developer or verified through the relevant planning authority.
Second, categories like "public/semi-public" can include a range of facilities, and the specific list can vary by project. It's worth asking directly what this category includes in this particular development, rather than assuming it matches another project you may have seen.
Third, the unspecified 8% in this dataset is a good reminder to ask questions rather than fill gaps with assumptions. A responsible buyer or researcher treats missing information as a prompt for further verification, not as an invitation to guess.
Finally, a favourable land-use mix is one factor among many. Location, connectivity, builder track record, legal clearances and pricing all matter just as much, if not more, when evaluating a project as a whole. Land-use percentages are a useful starting point for understanding planning intent, but they work best alongside other verified information.
Frequently Asked Questions
What is the First Phase land use distribution?
It refers to how land in the First Phase has been divided across different uses. The reported figures show approximately 35% residential, 27% green/open area, 25% public/semi-public use, and 5% commercial, together accounting for about 92% of the total.
How much land is planned for residential use?
Approximately 35% of the First Phase is reported as residential land, making it the single largest category in the distribution.
How much green or open area is included?
Green and open area accounts for approximately 27% of the First Phase, a relatively substantial share compared to many conventional layouts.
What does public and semi-public land use mean?
This category, at approximately 25% here, generally covers facilities that serve the community, such as institutional, civic or amenity spaces, though the exact list can vary by project and would need confirmation from official documents.
How much land is allocated for commercial use?
Commercial use is reported at approximately 5%, the smallest share among the four categories, suggesting a focus on convenience-level retail rather than large-scale commercial development.
Why do the four percentages only add up to 92%?
The available figures account for approximately 92% of the total distribution. The remaining 8% is not specified in the information provided, and no assumption should be made about what it represents without confirmation from an official source.
Does this land-use mix indicate an integrated urban development?
The mix of a large green/open share and public/semi-public allocation alongside residential and limited commercial land is a pattern often associated with integrated developments. However, this does not confirm any official classification unless explicitly stated by the relevant planning authority.
How is an integrated development different from a conventional plotted colony?
A plotted colony typically focuses on maximising individual saleable plots with limited shared space, while an integrated development plans housing, green space, public facilities and commercial use together as part of a broader living environment.
What should buyers understand about these land-use percentages?
Buyers should treat these figures as planning-stage information, verify details against official layout plans and approvals, ask specifically what falls under public/semi-public use, and avoid assuming what the unspecified 8% represents.
Conclusion
The First Phase land use distribution, as reported, shows a fairly balanced approach: roughly a third of the land for homes, more than a quarter for green and open space, a quarter for public and semi-public facilities, and a small share for commercial use. Together these account for about 92% of the total, with the remaining 8% left genuinely unspecified in the available information.
This mix suggests a planning approach that gives real consideration to open space and community facilities alongside housing, a pattern that often characterises integrated developments. But it's worth being careful not to read more into these numbers than they actually say. They describe how land has been divided, not the project's official classification, its construction status, or its regulatory approvals. For a complete and verified picture, the master plan and official project documentation remain the most reliable sources, and prospective buyers would do well to consult those directly before drawing firm conclusions.